http://www.zerohedge.com/news/bernankes-right-hand-dove-janet-yellen-hints-zirp-through-late-2015
 Submitted by Tyler Durden on 04/11/2012 19:23 -0400
Bernanke's Right Hand Dove, Janet Yellen, Hints At ZIRP Through Late 2015
Last week we had the Fed's hawks line up one after another telling us how no more QE would ever happen. We ignored them because they are simply the bad cops to the Fed's good cop doves. Sure enough, here comes Bernanke's right hand man, or in this case woman, hinting that one can forget everything the hawkish stance, and that ZIRP may last not until 2014, but 2015! Which, by the way, is to be expected: since ZIRP can never expire, it will always be rolled to T+3 years, as the short end will never be allowed to rise, until the Fed has enough FRNs in circulation to absorb the surge in rates without crushing the principal, as explained yesterday.
From her speech:
Cne can then employ the dynamics of one of the Federal Reserve's economic models, the FRB/US model, to solve for the optimal funds rate path subject to a particular loss function. Such a policy involves keeping the funds rate close to zero until late 2015. This highly accommodative policy path generates, according to the FRB/US model, a notably faster reduction in unemployment than in the baseline outlook. In addition, the inflation rate runs close to the FOMC's longer-run goal of 2 percent over coming years. According to the specified loss function, and in my opinion, this economic outcome would be more desirable than the baseline. One reason this exercise generates a better outcome is because it assumes that the Federal Reserve's inflation objective is fully credible--that is, all households and businesses fully understand the Federal Reserve's goals and believe that policymakers will follow the optimal policy designed to meet those goals. This belief ties down longer-term inflation expectations in the model even while it allows the lower interest rate to spur faster growth in output and employment.Oh and this:Nonetheless, the risk that continued high unemployment could eventually lead to more-persistent structural problems underscores the case for maintaining a highly accommodative stance of monetary policy.All of which explains why the EURUSD just took off. Incidentally none of this should come as a surprise to our readers: recall "Here Is Why The Fed Will Have To Do At Least Another $3.6 Trillion In Quantitative Easing" and of course "Putting It All Into Perspective." In a nutshell, there is at least another $3-4 trillion in more easing before this show is over. There is just the trivial issue of gas prices and election years to deal with but that too shall pass... in 7 months. After that, it's no holds barred CTRL+Ping.Full speech (pdf).
The Economic Outlook and Monetary PolicyI appreciate the opportunity to speak with you this evening. The Money Marketeers are renowned for their keen interest in the economy and monetary policy. With that in mind, I'll describe how my views concerning the stance of monetary policy relate to my assessment of the economic outlook. As you know, the Federal Open Market Committee (FOMC) issued statements following its January and March meetings indicating that it "currently anticipates that economic conditions--including low rates of resource utilization and a subdued outlook for inflation over the medium run--are likely to warrant exceptionally low levels for the federal funds rate at least through late 2014." I agreed with those judgments and, in my remarks tonight, I'll explain my views and describe some of the analytical tools that I use in making such policy decisfigure ions. I will also discuss the conditional nature of the Committee's policy stance. Let me emphasize at the outset that the remainder of my remarks reflect my own views and not those of others in the Federal Reserve System.1The Labor Market and the Economic Outlook
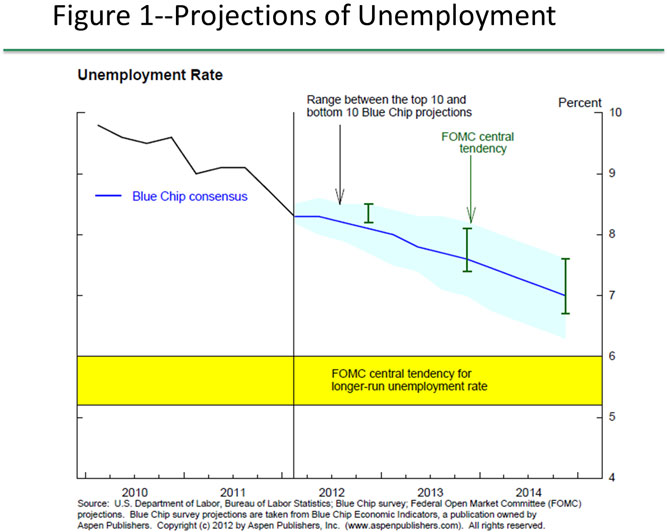
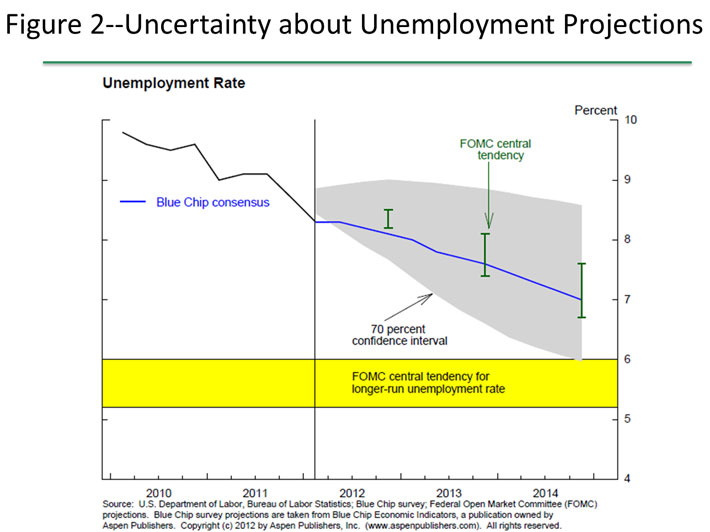
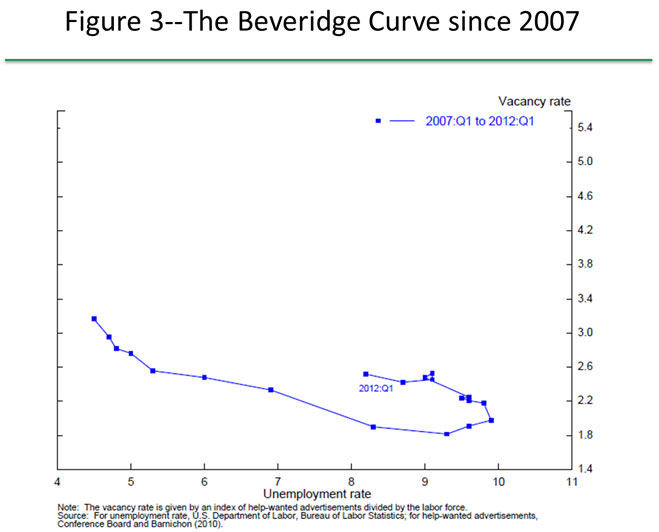
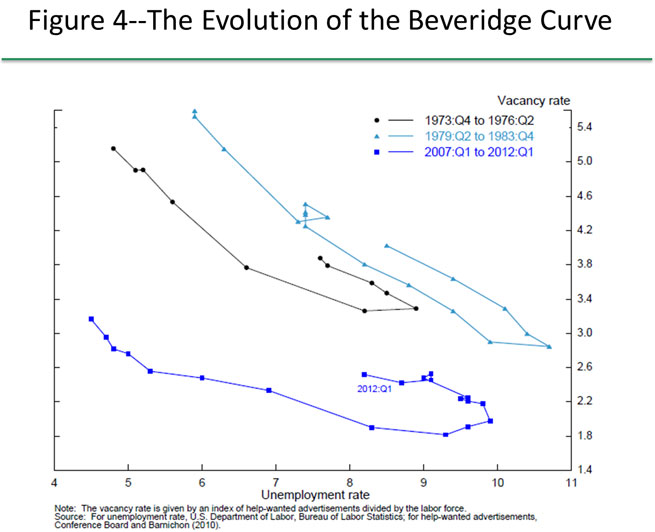
I will start by describing current conditions and key features of the economic outlook that influence my views on the appropriate stance of monetary policy. To summarize, the labor market has shown welcome signs of improvement. Even so, the economy remains far from full employment. Furthermore, the improvement in labor market conditions has outpaced the seemingly moderate growth of output. Looking ahead, significant headwinds are likely to continue to restrain aggregate spending, and progress in closing the remaining employment gap is likely to be quite gradual. Apart from sizable increases in gasoline prices, inflation has been subdued in recent months. While the jump in energy prices is pushing up inflation temporarily, I anticipate that subsequently inflation will run at or below the Committee's 2 percent objective for the foreseeable future. Let's examine the economic outlook in greater detail before considering how that outlook shapes my views on appropriate policy.Starting with the labor market, as I mentioned, there have been encouraging signs of improvement in recent months. The unemployment rate had hovered around 9 percent for much of last year but moved down in the fall and averaged 8-1/4 percent in the first three months of this year, about 1-3/4 percentage points lower than its peak during the recession. And even though the latest employment report was somewhat disappointing, private sector payrolls expanded, on average, by about 210,000 per month in the first quarter, up from gains averaging around 150,000 per month during most of 2011. Other labor market indicators have shown similar improvement.This news is certainly welcome, yet it must be kept in perspective. Our economy is recovering from the steepest and most prolonged economic downturn since the 1930s, and these job gains still leave us far short of where we need to be. The level of private payrolls remains nearly 5 million below its pre-recession peak, and the unemployment rate stands well above levels that I, and most analysts, judge as normal over the longer run.Figure 1 shows the unemployment rate together with the outlook of professional forecasters from last month's Blue Chip survey.2 The solid blue line shows the Blue Chip consensus and the blue shading denotes the range between the top 10 and bottom 10 projections of forecasters in the March Blue Chip survey. The figure also shows the central tendency of the unemployment projections that my FOMC colleagues and I made at our January meeting: Those projections reflect our assessments of the economic outlook given our own individual judgments about the appropriate path of monetary policy. As in the Blue Chip consensus outlook, FOMC participants' projections indicate that unemployment will decline gradually from current levels. Included in the figure as well is the central tendency of FOMC participants' estimates of the longer-run normal unemployment rate, which ranges from 5.2 percent to 6 percent. The unemployment rate is expected to remain well above its longer-run normal value over the next several years.As you know, economic forecasts always entail considerable uncertainty. Figure 2 illustrates the degree of uncertainty surrounding projections of unemployment. The gray shading denotes a model-based 70 percent confidence interval for the unemployment rate, based on the sorts of shocks that have hit the economy over the past 40 years.3 Judging from historical experience, the consensus projection could be quite far off, in either direction. That said, the figure also shows that labor market slack at present is so large that even a very large and favorable forecast error would not change the conclusion that slack will likely remain substantial for quite some time.Some observers question just how large the shortfall from full employment really is and hence worry that further increases in aggregate demand could push up inflation. Their concern is that a large part of the rise in unemployment since 2007 is structural rather than cyclical. I agree that the magnitude of structural unemployment is uncertain, but I read the evidence as supporting the view that the bulk of the rise in unemployment that we saw in recent years was cyclical, not structural in nature. Assessments concerning the degree of slack in the labor market are highly relevant to an evaluation of the appropriate stance of policy, so I'd like to review my reasoning in some detail.First, the fact that the rise in unemployment was quite widespread across industry and occupation groups casts doubt on the hypothesis that there has been an unusually large mismatch between the types of job vacancies and the types of workers available to fill them. Certainly, job losses in the construction sector and in financial services were particularly sharp--not surprising given the collapse in the housing market and in the financial sector that we saw in 2008--but so were losses in manufacturing and other highly cyclical industries that typically are hit especially hard in recessions. Indeed, measures of the dispersion of employment changes across industries did not increase more than past experience would have predicted given the depth of the recession.Some commentators have noted that "house lock"--the reluctance or inability of homeowners to sell in a declining price environment or when underwater on their mortgages--may be preventing people from moving to find available jobs in new locations. However, evidence from migration patterns suggests that house lock is not having a significant effect on the level of structural unemployment. While migration within the United States has been trending down for some time, the reduction in mobility during the recession was not greater for homeowners than for renters, nor was it especially pronounced for areas where housing prices have declined the most and so where house lock would likely be most prevalent.4Finally, I do not interpret data suggesting an outward shift in the Beveridge curve as providing much evidence in favor of an increase in structural unemployment. The Beveridge curve plots the relationship between unemployment and job vacancies. Cyclical variations in aggregate demand tend to move unemployment and job vacancies in opposite directions, whereas structural shifts would be expected to move vacancies and unemployment in the same direction. For instance, a structural mismatch between businesses' hiring needs and the skills of unemployed workers would tend to push up the level of vacancies for a given level of unemployment.Figure 3 plots the co-movement of unemployment and job vacancy rates since 2007.5 Consistent with a substantial decline in aggregate demand, followed by some modest recovery, movements in unemployment and vacancies since 2007 display a predominantly inverse relationship. However, figure 3 shows that as job vacancies have risen during the recovery, unemployment has declined by less than might have been expected based on the relationship that prevailed during the contraction. This outcome has led some to suggest that the Beveridge curve has shifted outward, reflecting an increase in the extent of job mismatch. In my view, a portion of this apparent outward shift in the Beveridge curve reflects increases in the maximum duration of unemployment benefits, which have been important in buffering the effects of the weak labor market on workers and their families. The influence of these benefits will dissipate as they are phased out and the economy recovers. In addition, loop-like movements around the Beveridge curve are common during recoveries. Vacancies typically adjust more quickly than unemployment to changes in labor demand, causing counterclockwise movements in vacancy-unemployment space that can look like shifts in the Beveridge curve. Figure 4 plots the relationship seen during and after the 1973 and 1982 recessions alongside the current episode. As can be seen, such counterclockwise movements also occurred during these two earlier deep recessions.6While I do not see much evidence of any significant increase in structural unemployment so far, I am concerned that structural unemployment could increase over time if the labor market heals too slowly--a phenomenon known as hysteresis. An exceptionally large fraction of those now unemployed--more than 40 percent--have been out of work for six months or more. My concern is that individuals with such long unemployment spells could become less employable as their skills deteriorate and as they lose their connections to the labor market. This outcome does not appear to have occurred in the wake of previous U.S. recessions, but the fraction of the unemployed who have been out of work for a long period is much higher now than it has been in the past. To date, I have not seen evidence that hysteresis is occurring to any substantial degree. For example, the probability of finding a new job has not deteriorated more for individuals experiencing a long-term bout of unemployment relative to those facing shorter spells. Nonetheless, the risk that continued high unemployment could eventually lead to more-persistent structural problems underscores the case for maintaining a highly accommodative stance of monetary policy.Putting all the evidence together, I see no good reason to doubt that our nation's high unemployment rate indicates a substantial degree of slack in the labor market. Moreover, while I recognize the significant uncertainty surrounding such forecasts, I anticipate that growth in real gross domestic product (GDP) will be sufficient to lower unemployment only gradually from this point forward, in part because substantial headwinds continue to restrain the recovery.One headwind comes from the housing sector, which has typically been a driver of business cycle recoveries. We have seen some improvement recently, but demand for housing is likely to pick up only gradually given still-elevated unemployment, uncertainties over the direction of house prices, and mortgage credit availability that seems likely to remain very restricted for all but the most creditworthy buyers. When housing demand does pick up more noticeably, the huge overhang of both unoccupied dwellings and homes in the foreclosure pipeline will likely allow demand to be met for a time without a sizable expansion in homebuilding.A second headwind comes from fiscal policy. State and local governments continue to face extremely tight budget situations in light of the weak economy, depressed home prices, and the phasing out of federal stimulus grants, though overall tax revenues have been improving and that should continue as the economy expands further. At the federal level, stimulus-related policies are scheduled to wind down, while both real defense and nondefense purchases are expected to decline over the next several years under the spending caps put in place last year.A third factor weighing on the outlook is the sluggish pace of economic growth abroad. Strains in global financial markets have eased somewhat since late last year, an improvement that reflects in part policy actions taken by European authorities. Nonetheless, risk premiums on sovereign debt and other securities are still elevated in many European countries, while European banks continue to face pressure to shrink their balance sheets, and concerns about the outlook for the region remain. A further slowdown in economic activity in Europe and in other foreign economies would inhibit U.S. export growth.For these reasons, I anticipate that the U.S. economy will continue to recover only gradually and that labor market slack will remain substantial for a number of years to come.One consideration that further complicates this outlook is the inconsistency between recent movements in economic growth and employment: Unemployment has declined significantly over the past year even though growth appears to have been only moderate. This unanticipated decline in the unemployment rate presents something of a puzzle, and it creates uncertainties for the outlook and policy.To illustrate this puzzle, figure 5 plots changes in the unemployment rate against real GDP growth--a simple portrayal of the relationship known as Okun's law. It is evident from the figure that 2011 is something of an outlier, with the drop in the unemployment rate last year much larger than would seem consistent with real GDP growth below 2 percent. One possibility, highlighted by Chairman Bernanke in a recent speech, is that last year's decline in unemployment represents a catch-up from the especially large job losses during late 2008 and 2009.7 According to this hypothesis, employers slashed employment especially sharply during the recession, perhaps out of concern that the contraction could become even more severe; in particular, the figure shows that in 2009, the unemployment rate rose by considerably more than the decline in GDP would have suggested. Then, last year, employers may have become confident enough in the recovery to increase hiring and relieve the unsustainable strain that the earlier cutbacks had placed on their workforces. I think the evidence is consistent with this hypothesis, and I have incorporated it into my own modal forecast.If last year's Okun's law puzzle was largely the result of such a catch-up in hiring, I would expect progress on the unemployment front to diminish unless the pace of GDP growth picks up. After all, catch-up can go on for only so long. Of course, there are other conceivable explanations for this puzzle, including some that would point to a faster decline in unemployment in coming years. For example, GDP could have risen more rapidly over the past year than current data indicate. It will be important to pay close attention to indicators of both the labor market and GDP to try to gauge the likely pace of improvement in economic activity going forward and, hence, the appropriate stance of monetary policy over time.Let me now turn to inflation. Overall consumer price inflation has fluctuated quite a bit in recent years, largely reflecting movements in prices for oil and other commodities. For example, inflation moved up in the first part of 2011 as a rise in the price of oil and other commodities fed through to gasoline prices, and, to a lesser extent, to prices of other goods and services. Then inflation subsided after commodity prices came off their peaks. More recently, prices of crude oil, and thus of gasoline, have turned up again. But smoothing through these fluctuations, inflation as measured by the personal consumption expenditures (PCE) price index averaged 2 percent over the past two years. Using the price index excluding food and energy--another rough way to abstract from transitory fluctuations--inflation averaged about 1-1/2 percent over the past two years. These rates are lower than the inflation rates that were seen prior to the recession, and they are at or below the FOMC's long-run goal of 2 percent inflation.In my view, the subdued inflation environment largely reflects two factors. First, the substantial slack in the labor market has restrained inflation by holding down labor costs. Second, and of critical importance, longer-term inflation expectations have been remarkably stable. Like many other observers, I was concerned that inflation expectations might move lower during the recession, driving down both wages and prices in a self-reinforcing spiral. The Federal Reserve acted forcefully to resist such an outcome and, fortunately, that destructive dynamic did not take hold. Indeed, the stability of expectations has meant that the price increases driven by costs of oil and other commodities have had only temporary effects on the rate of inflation. Although firms passed higher input costs into their prices when they could do so, those one-time price increases have not led to an expectations-driven process that might have resulted in persistently higher inflation.The same key factors that have kept core inflation subdued provide the rationale for my inflation forecast. I anticipate that slack in the labor market will continue to restrain growth in labor costs and prices. And, given the stability of inflation expectations, I expect that the latest round of gasoline price increases will also have only a temporary effect on overall inflation. Indeed, if crude oil prices were to follow the downward-sloping path implied by current futures contracts, energy costs would serve as a restraining influence on overall inflation over the next several years. Figure 6 presents the central tendency of FOMC participants' projections of inflation at the time of our January meeting. Most expected inflation to be at, or a bit below, our long-run objective of 2 percent through 2014; most private forecasters also appear to expect inflation by this measure to be close to 2 percent.8 As with unemployment, uncertainty around the inflation projection is substantial.Benchmarks for Assessing Monetary Policy: Optimal Control
As I indicated at the outset of my remarks, I supported the Committee's statements in January and March pertaining to the stance of monetary policy. I will now explain the rationale for my judgments, and I will describe some of the tools that I use to make such assessments. I consider it essential, in making judgments about the stance of policy, to recognize at the outset the limits of our understanding regarding the dynamics of the economy and the transmission of monetary policy. Because I see no magic bullet for determining the "right" stance of policy, I commonly consider a number of different approaches.One approach I find helpful in judging an appropriate path for policy is based on optimal control techniques. Optimal control can be used, under certain assumptions, to obtain a prescription for the path of monetary policy conditional on a baseline forecast of economic conditions. Optimal control typically involves the selection of a particular model to represent the dynamics of the economy as well as the specification of a "loss function" that represents the social costs of deviations of inflation from the Committee's longer-run goal and of deviations of unemployment from its longer-run normal rate. In effect, this approach assumes that the policymaker has perfect foresight about the evolution of the economy and that the private sector can fully anticipate the future path of monetary policy; that is, the central bank's plans are completely transparent and credible to the public.9To show what an optimal control approach might have called for at the time of the January FOMC meeting, figure 7 depicts a purely illustrative baseline outlook constructed using the distribution of FOMC participants' projections for unemployment, inflation, and the federal funds rate that we published in January. Here, the baseline paths for unemployment and inflation track the midpoint of the central tendency of the Committee's projections through 2014. The unemployment rate gradually converges to around 5-1/2 percent--roughly the midpoint of the central tendency of participants' long-run projections of these factors--and inflation converges to the Committee's longer-run goal of 2 percent. The baseline path for the funds rate stays near zero through late 2014 and then rises steadily back to the long-run value expected by most participants. While this path is consistent with the January and March statements, I hasten to add that both the assumed date of liftoff and the longer-run pace of tightening are merely illustrative and are not based on any internal FOMC deliberations.10Given this baseline, one can then employ the dynamics of one of the Federal Reserve's economic models, the FRB/US model, to solve for the optimal funds rate path subject to a particular loss function.11 Such a policy involves keeping the funds rate close to zero until late 2015. This highly accommodative policy path generates, according to the FRB/US model, a notably faster reduction in unemployment than in the baseline outlook. In addition, the inflation rate runs close to the FOMC's longer-run goal of 2 percent over coming years. According to the specified loss function, and in my opinion, this economic outcome would be more desirable than the baseline. One reason this exercise generates a better outcome is because it assumes that the Federal Reserve's inflation objective is fully credible--that is, all households and businesses fully understand the Federal Reserve's goals and believe that policymakers will follow the optimal policy designed to meet those goals. This belief ties down longer-term inflation expectations in the model even while it allows the lower interest rate to spur faster growth in output and employment.While optimal control exercises can be informative, such analyses hinge on the selection of a specific macroeconomic model as well as a set of simplifying assumptions that may be quite unrealistic. I therefore consider it imprudent to place too much weight on the policy prescriptions obtained from these methods, so I simultaneously consider other approaches for gauging the appropriate stance of monetary policy.Alternative Benchmarks for Monetary Policy: Simple Rules
An alternative approach that I find helpful in evaluating the stance of policy is to consult prescriptions from simple policy rules. Research suggests that these rules perform well in a variety of models and tend to be more robust than the optimal control policy derived from any single macroeconomic model.12 Of course, a wide variety of simple rules have been proposed in the academic literature, and their policy implications can differ significantly depending on the particular specification. Moreover, given our statutory mandate of maximum employment and price stability, it seems reasonable to focus on rules that mirror these two objectives by prescribing how the federal funds rate should be adjusted in response to two gaps: the deviation of inflation from its longer-run goal and the deviation of unemployment from my estimate of its longer-run normal rate. In my view, rules specified along these lines can serve as useful benchmarks for gauging the stance of policy and for communicating with the public about the rationale for our policy decisions.Indeed, in the statement on longer-run goals and policy strategy that the FOMC issued in January, we underscored our commitment to following a "balanced approach" in promoting our dual objectives. The commitment to a balanced approach has crucial implications when it comes to choosing sensible benchmarks from among the many alternative policy rules. In particular, any benchmark rule should conform to the so-called Taylor principle, which states that, other things being equal, a central bank should respond to a persistent increase in inflation by raising nominal short-term interest rates by more than the increase in inflation so that the real rate of interest rises, thereby helping to bring inflation back down. Moreover, I think it is essential that policy rules incorporate a sufficiently strong response to resource slack, typically either the output gap or the unemployment gap, to help bring the economy back toward full employment expeditiously.John Taylor has proposed two simple and well-known policy rules along these lines. The rule that Taylor proposed in 1993 incorporates a fairly modest response to economic slack. Later, in a 1999 study, he considered a variant of that rule that was twice as responsive to slack.13 Taylor himself continues to prefer his original rule, which I will refer to as the Taylor (1993) rule. In my view, however, the later variant--which I will refer to as the Taylor (1999) rule--is more consistent with following a balanced approach to promoting our dual mandate. Importantly, because of the stabilizing effects of the Taylor principle, both the Taylor (1993) and Taylor (1999) rules imply that inflation returns over time to the longer-run goal of 2 percent.14Figure 8 shows the projected paths for the federal funds rate called for by these two policy rules, along with the optimal control path that I presented earlier.15 These projections are constructed using the FRB/US model, conditioned on the same illustrative baseline outlook that I used a moment ago. The Taylor (1993) rule calls for the federal funds rate to begin rising in early 2013, whereas the Taylor (1999) rule has its liftoff in early 2015, a lot closer to the optimal control path. A sizable literature has examined the performance of simple rules like these by conducting stochastic simulations with a range of economic models. Many studies, including Taylor's own analysis, suggest that the Taylor (1999) rule generates considerably less variability in real activity and only slightly more variability in inflation than his original rule.16 Given the differential responses to economic slack across these two rules, this finding is hardly surprising, but it is a key reason why I consider the Taylor (1999) rule to be a more suitable guide for Fed policy.While the Taylor (1999) rule can serve as a useful policy benchmark, its prescriptions fail to take into account some considerations that I consider important in the current context. In particular, this rule does not fully take into account the implications of the zero lower bound on nominal interest rates and hence tends to understate the rationale for maintaining a highly accommodative stance of monetary policy under present circumstances.Importantly, resource utilization rates have been so low since late 2008 that a variety of simple rules have been calling for a federal funds rate substantially below zero, which of course is not possible. Consequently, the actual setting of the target funds rate has been persistently tighter than such rules would have recommended. The FOMC's unconventional policy actions--including our large-scale asset purchase programs--have surely helped fill this "policy gap" but, in my judgment, have not entirely compensated for the zero-bound constraint on conventional policy. In effect, there has been a significant shortfall in the overall amount of monetary policy stimulus since early 2009 relative to the prescriptions of the simple rules that I've described.Analysis by some of my Federal Reserve colleagues suggests that monetary policy can produce better economic outcomes if it commits to making up for at least some portion of the cumulative shortfall created by the zero lower bound--namely, by maintaining a highly accommodative monetary policy for longer than a simple rule would otherwise prescribe.17 This consideration is one important reason that the optimal control simulation generates a more accommodative path than the Taylor (1999) rule.Risk-management considerations strengthen the case for maintaining a highly accommodative policy stance longer than might otherwise be considered appropriate. In particular, the FOMC has considerable latitude to withdraw policy accommodation if the economic recovery were to proceed much faster than expected or if inflation were to come in higher. In contrast, if the recovery faltered or inflation drifted down, the Committee could provide additional stimulus using its unconventional tools, but doing so involves costs and risks. Given the unprecedented nature of the current economic situation and the limits placed on conventional policy by the zero lower bound on interest rates, these issues of risk management take on special importance.More broadly, these considerations help illustrate why it would be imprudent to adhere mechanistically to the prescriptions of anysingle policy rule. Such rules can serve as useful benchmarks for facilitating monetary policy deliberations and communications, but a dose of good judgment will always be essential as well.Uncertainty and Policy Conditionality
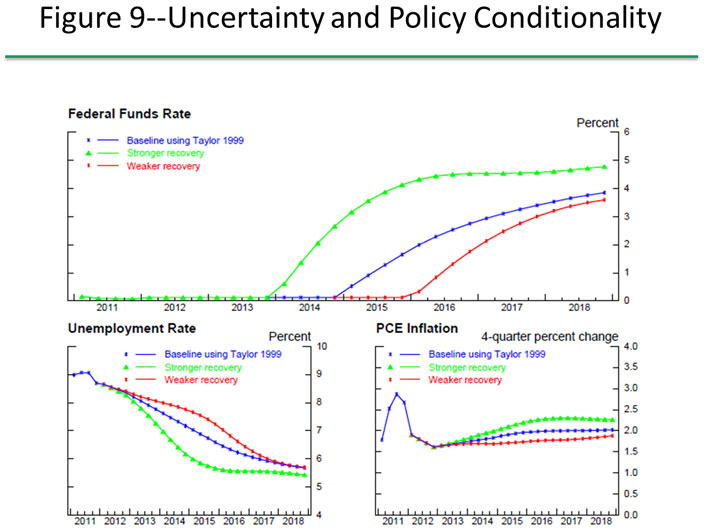
The policy prescriptions I've discussed thus far are conditioned on an illustrative baseline forecast for unemployment and inflation. Because any economic forecast is inherently uncertain, the FOMC's forward policy guidance states explicitly that the Committee "currently anticipates" that economic conditions are likely to warrant such a stance of policy. The guidance does not state that the Committee will keep the funds rate exceptionally low until at least late 2014. I'd consider it completely appropriate to modify the specification of the forward guidance in response to significant changes in the economic outlook.Potential modifications of the forward guidance can be illustrated by showing how the Taylor (1999) rule responds to two different shifts in the outlook. Figure 9 shows one scenario in which the recovery turns out to be unexpectedly strong, with the unemployment rate reaching 6 percent by the end of 2014 and inflation moving a little above 2 percent later in the decade. It also shows a second scenario in which the recovery is unexpectedly weak, with the unemployment rate remaining above 8 percent until early 2014. In this scenario, inflation stays persistently below 2 percent. In the stronger scenario, the Taylor (1999) rule calls for the liftoff from the zero lower bound to move forward to the beginning of 2014. In that event, of course, the FOMC would not only raise the federal funds rate sooner than our current guidance suggests but would also begin to remove other forms of accommodation and draw down the balance sheet sooner than in the baseline. In contrast, in the weaker scenario, the Taylor (1999) rule calls for the liftoff to be delayed until the first half of 2016. The model's recommendation for a later liftoff in this scenario could alternatively provide an argument for additional policy accommodation through other means, including additional asset purchases.The current economic outlook is associated with significant risks in both directions. In particular, we know that recoveries from financial crises are commonly prolonged, and I remain concerned that the headwinds that have been restraining the recovery could lead to a longer period of sluggish growth and high unemployment than is embodied in the consensus forecasts. One specific risk is that elevated uncertainty about prospective fiscal policy adjustments could weigh on the spending plans of households and businesses. In addition, it's conceivable that the European situation could deteriorate and prompt a significant increase in global financial market stress. Such developments would likely have substantial adverse effects on U.S. economic activity and inflation.Potential upside surprises to the outlook include the possibility that the recovery has greater underlying momentum than is incorporated in consensus forecasts. As I noted, the decline we've seen in the unemployment rate could conceivably indicate that GDP has been rising significantly faster than now estimated. Alternatively, the economy's productive potential could be less than I judge, in which case inflationary pressures could emerge sooner than I expect.18Conclusion
In summary, I expect the economic recovery to continue--indeed, to strengthen somewhat over time. Even so, over the next several years, I anticipate that we will fall far short in achieving our maximum employment objective, and I expect inflation to remain at or below the FOMC's longer-run goal of 2 percent. A range of considerations, including those relating to uncertainty and asymmetric risks, must inform one's judgment on the appropriate stance of policy. As I explained, a variety of analytical tools, including optimal control techniques and simple policy rules, can serve as useful benchmarks. Based on such analysis, I consider a highly accommodative policy stance to be appropriate in present circumstances. But considerable uncertainty surrounds the outlook, and I remain prepared to adjust my policy views in response to incoming information. In particular, further easing actions could be warranted if the recovery proceeds at a slower-than-expected pace, while a significant acceleration in the pace of recovery could call for an earlier beginning to the process of policy firming than the FOMC currently anticipates.
Tidak ada komentar:
Posting Komentar